Mastering Support and Resistance: A Practical Guide for New Traders
Learn about support and resistance levels to enhance your trading strategies and decision-making.
By Laurie Suarez
Learn about support and resistance levels to enhance your trading strategies and decision-making.
Understanding Support and Resistance in Trading
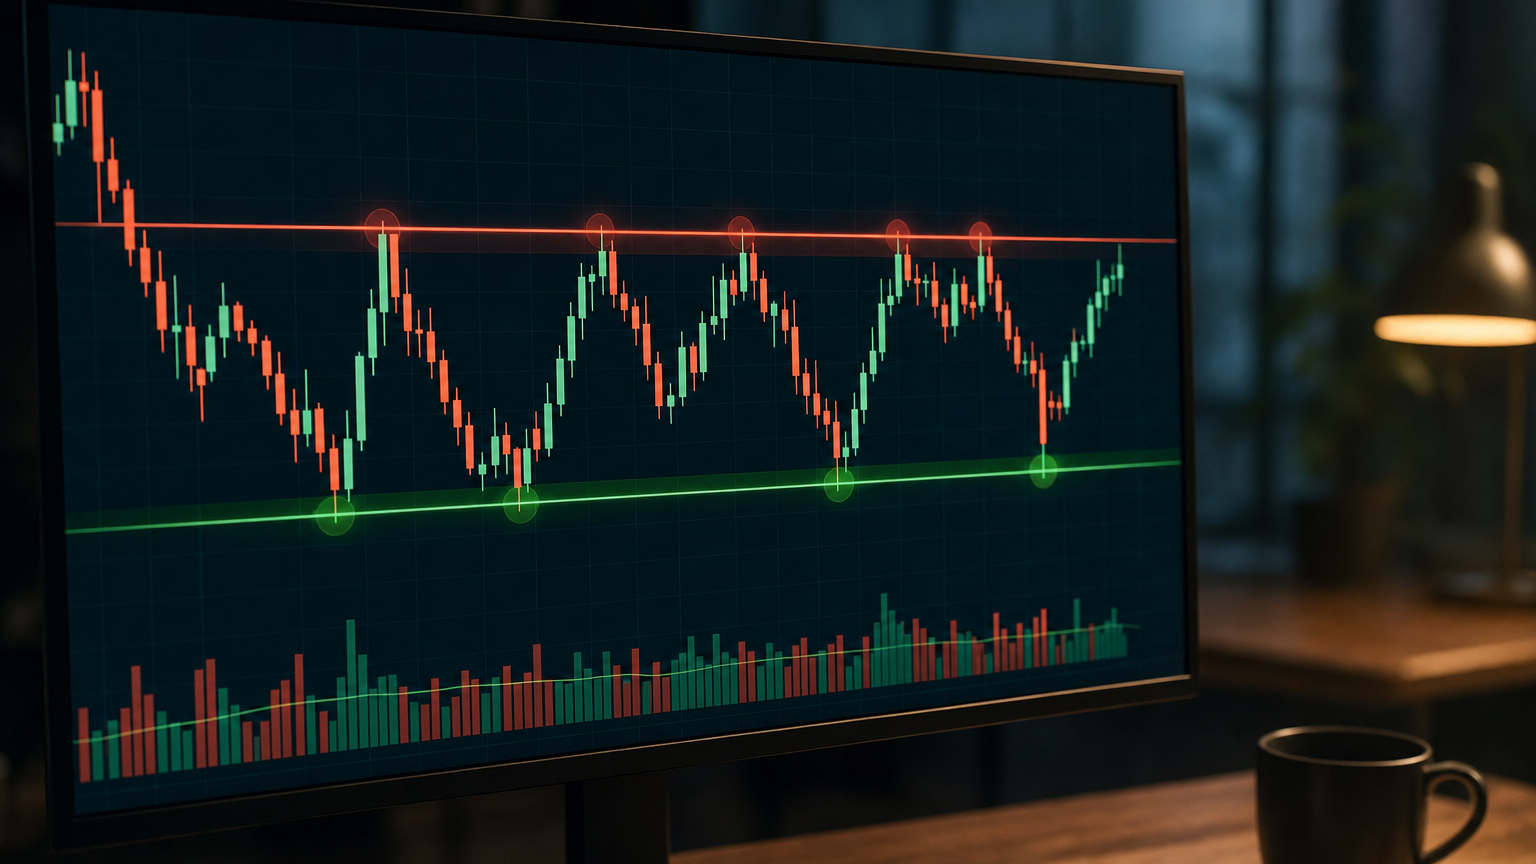
Support and resistance are foundational concepts in technical analysis that every trader should master. These levels are pivotal in determining price movements and can significantly influence trading strategies. In essence, support refers to price levels where an asset tends to stop falling and may bounce back, while resistance denotes levels where the asset struggles to rise further. Understanding these levels can enhance a trader's decision-making process, especially for newcomers.
The Importance of Support and Resistance
Identifying support and resistance levels is crucial because they help traders gauge potential price reversals or consolidations. For new traders, recognizing these levels can serve as a guide for entry and exit points in their trades. When an asset approaches a support level, traders might anticipate a bounce back, while a touch at a resistance level could signal a potential price decline.
Recent trends show that advanced trading platforms now incorporate tools that utilize algorithmic analysis and machine learning to identify these critical price levels. This innovation allows for more accurate assessments, enabling traders to visualize and react to market movements more effectively.
Key Characteristics of Support and Resistance Levels
Practical Applications in Trading Strategies
Utilizing support and resistance levels effectively can refine trading strategies in several ways: - <strong>Entry and Exit Points</strong>: Traders can use these levels to set entry points for buying at support levels and exit points for selling at resistance levels. This strategy can help optimize trade outcomes, as noted by <a href="https://school.stockcharts.com" target="_blank" rel="noopener noreferrer" class="text-gold-400 hover:text-gold-300 underline decoration-gold-500/30">The Chart School by StockCharts</a>. - <strong>Stop-Loss Orders</strong>: Placing stop-loss orders just below support levels or above resistance levels can protect traders from significant losses when the market moves against them. - <strong>Trend Confirmation</strong>: A breakout above a resistance level or a drop below a support level can provide confirmation of a trend change. Traders often look for these signals to confirm their market positions.
The Role of Technology in Identifying Levels
The integration of artificial intelligence in trading software has transformed how traders identify support and resistance levels. Modern platforms can analyze vast amounts of historical price data in real-time, highlighting potential levels based on patterns and market sentiment. This advancement is particularly beneficial for new traders who may not yet have the experience to identify these levels manually.
Furthermore, algorithmic trading can automate the execution of trades based on predefined support and resistance strategies, allowing traders to capitalize on market movements efficiently. By leveraging technology, traders can enhance their market analysis and decision-making processes.
Conclusion: Enhancing Trading Skills with Support and Resistance
Mastering support and resistance levels is essential for new traders seeking to enhance their trading strategies. As market conditions evolve, staying informed about these concepts and utilizing advanced trading tools will help traders navigate the complexities of the financial markets. By understanding where prices may reverse or consolidate, traders can make informed decisions that align with their financial goals.
In summary, support and resistance are not just static levels; they are dynamic indicators of market psychology and behavior. New traders equipped with this knowledge, along with the right tools, can significantly improve their trading outcomes.